AI agent observability means recording enough about each run to rebuild what the agent did afterwards: which model calls it made, which tools it called, and, for agents that use the web, every HTTP request, its status code, every retry, and the exit it went out through. Agent frameworks cover the first two well. The web layer is usually missing, and that's where blocks, rate limits, and retries happen.
We measured the gap. A Claude agent read five product pages through a fetch tool while Claude Code exported its own OpenTelemetry traces. Two pages were blocked: one with a 403 challenge and one with a block page served as 200 OK. Claude Code recorded all 5 tool calls as success=true in all 4 runs. A page that got 429, 429, then 200 showed up as a single 4-second tool span with no attempt count. The model's answer was correct every time. The telemetry wasn't.
There are two fixes. The tool tells the agent runtime when a page was blocked, and the tool emits its own spans, one per HTTP attempt, keyed by the tool call ID. Both are below, with the test, a tested Python snippet, and the dashboards worth building on top.
What AI agent observability covers
A web agent's run passes through four layers, and each one answers different questions:
| Layer | What it records | Questions it answers | Who usually emits it |
|---|---|---|---|
| Model calls | Prompt, output, tokens, latency, cost | Why did the agent choose this step? What did the run cost? | Agent framework, LLM observability platform |
| Tool calls | Tool name, arguments, result size, duration, success | Which tools ran, in what order, and how long did they take? | Agent framework |
| HTTP attempts | Method, URL, status, retry number, response headers | Was the page served, blocked, or rate limited? How many requests did the site actually see? | Your tool code or HTTP client instrumentation |
| Network egress | Proxy session, exit IP, CONNECT tunnels, proxy errors | Which exit did the site see? Did the proxy or the site fail? | Your tool code, proxy logs |
LLM observability platforms such as Langfuse, Arize Phoenix, and LangSmith accept OpenTelemetry traces over OTLP, so all four layers can end up in one trace view. The first two layers come almost for free. The last two only exist if your tool code produces them.
OpenTelemetry already has names for this. The GenAI semantic conventions define an execute_tool span with gen_ai.tool.name and gen_ai.tool.call.id, still marked Development. The HTTP client span conventions say instrumentations "SHOULD create an HTTP span for each attempt to send an HTTP request over the wire," and they define http.request.resend_count for retries. In our tests, the agent runtime and the common Python HTTP instrumentations both stopped short of that.
Test: what an agent's own telemetry records for blocked pages
Setup
We built a local mock store with five product pages, each with a different failure:
/product/1: a normal page,200/product/2: a "Please verify you are a human" block page served with200/product/3:429withRetry-After: 2on the first two requests, then200/product/4:403withcf-mitigated: challengeand a "Just a moment..." body, the header Cloudflare documents for challenge pages/product/5:503once, then200
The agent was Claude Code 2.1.310 in claude -p mode on claude-haiku-5-5. Its only tool was a small MCP stdio server with a fetch_page tool that owns its retries: it waits for Retry-After on 429 and 503, up to 3 attempts. That's the design AI agent architecture recommends, because the model can't wait between calls.
We turned on Claude Code's built-in OpenTelemetry export, including the beta tracing:
export CLAUDE_CODE_ENABLE_TELEMETRY=1
export CLAUDE_CODE_ENHANCED_TELEMETRY_BETA=1
export OTEL_TRACES_EXPORTER=otlp OTEL_LOGS_EXPORTER=otlp OTEL_METRICS_EXPORTER=none
export OTEL_EXPORTER_OTLP_PROTOCOL=http/json
export OTEL_EXPORTER_OTLP_ENDPOINT=http://127.0.0.1:19411
export OTEL_LOG_TOOL_DETAILS=1 OTEL_LOG_TOOL_CONTENT=1
A small collector on that port saved every OTLP payload. We ran the task 4 times with a plain fetch tool that returns HTTP <status> plus the page text and never sets isError. Then we ran it 3 times with a flagged version that returns isError: true when the page was blocked.
Results
Each run took 6 turns, 8.3 to 8.8 seconds, and $0.0004 to $0.0006. The store logged 8 requests per run for 5 tool calls. All 7 runs gave the same telemetry pattern:
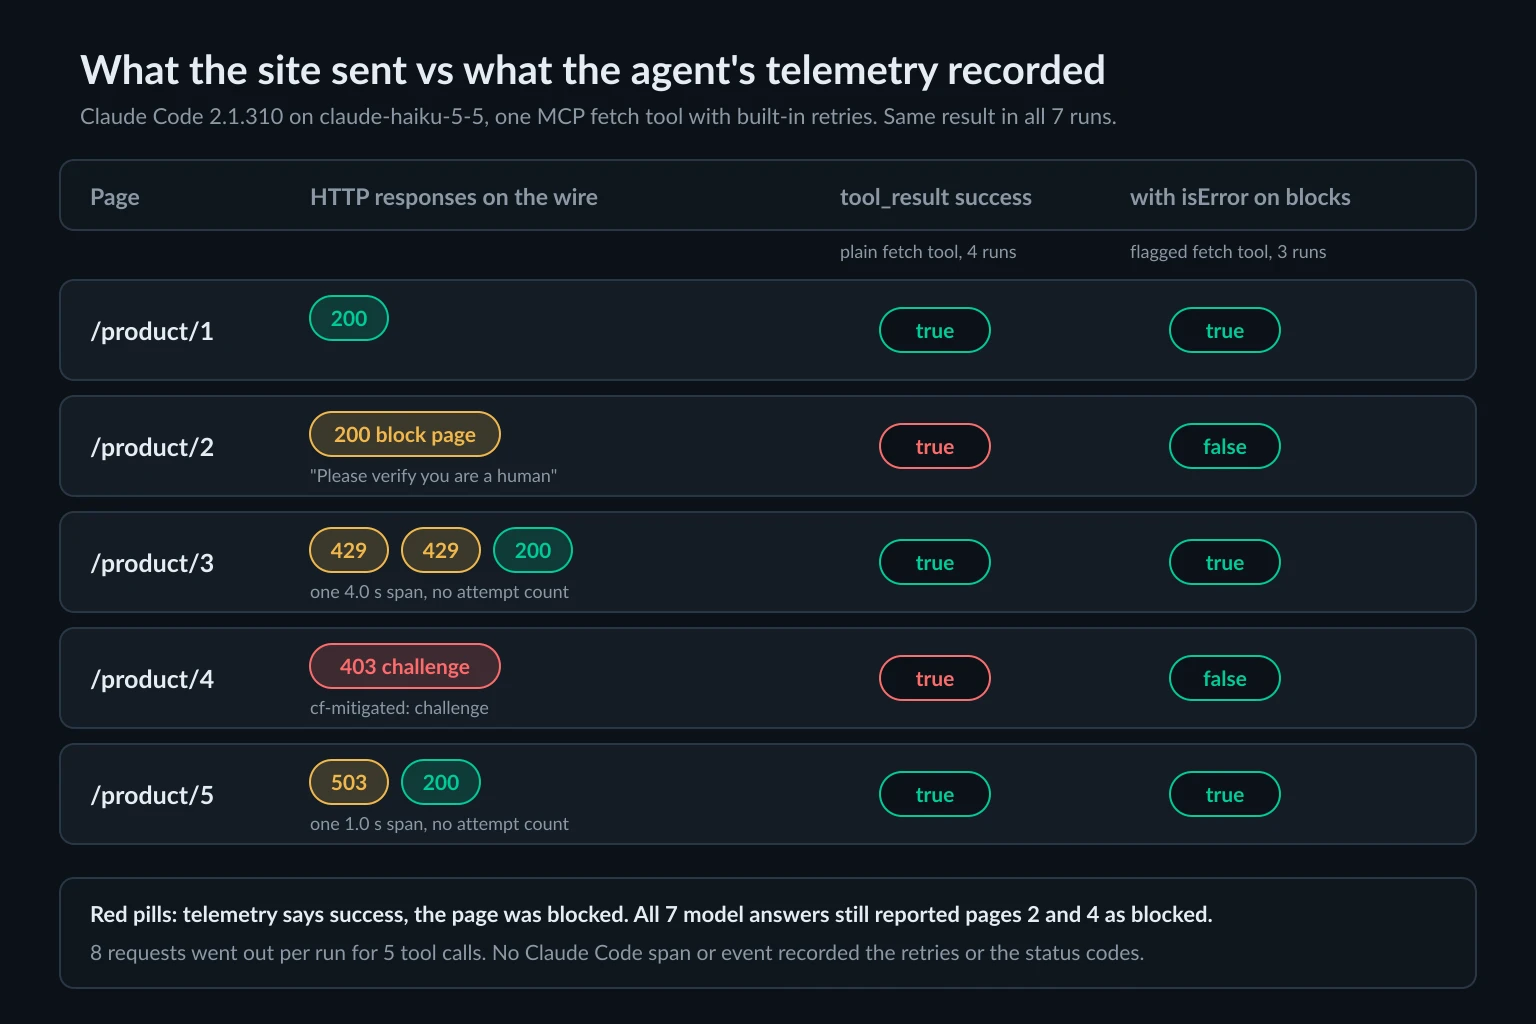
- Blocked pages were recorded as successes. With the plain tool, the
tool_resultevent saidsuccess: "true"for the403challenge and for the200block page in 4 of 4 runs. Every span had statusUNSET. The block appeared in only one place in the telemetry: the raw page text in thetool.outputspan event, which exists only because we opted in withOTEL_LOG_TOOL_CONTENT=1. isErrorfixed the success flag, not every span. With the flagged tool, both blocked calls becamesuccess: "false"witherror_type: "McpToolCallError", and theclaude_code.tool.executionspan got statusERRORin 3 of 3 runs. Its parentclaude_code.toolspan stayedUNSET. A dashboard that counts errors on the parent span would still show zero.- Retries were invisible.
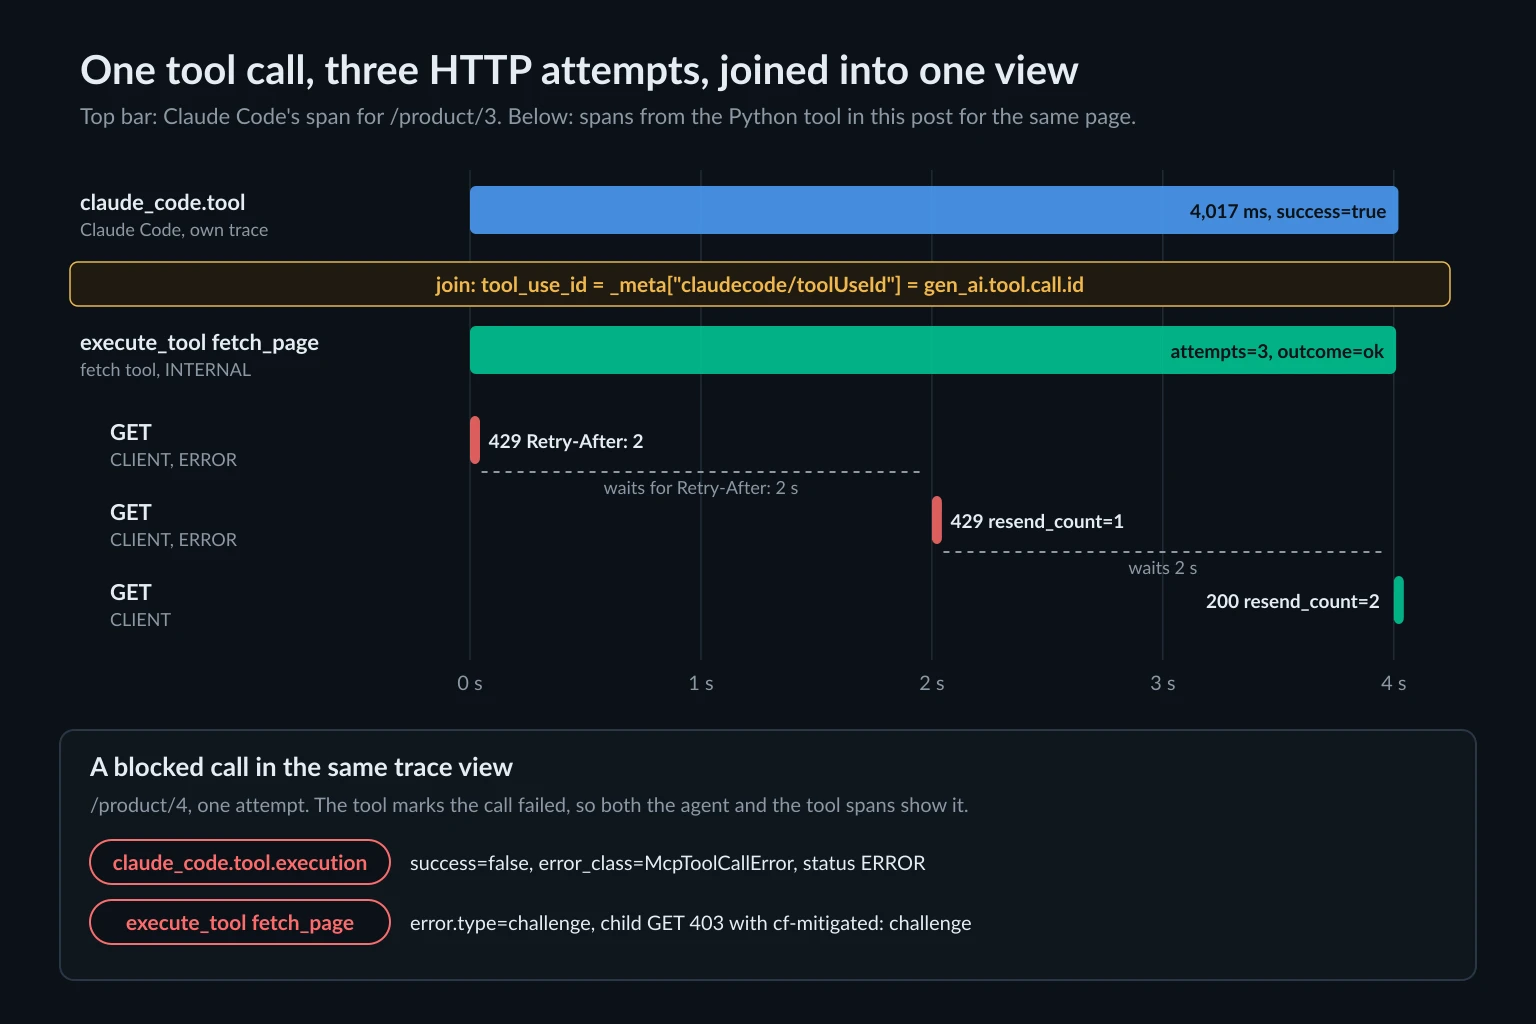
/product/3became oneclaude_code.toolspan of 4,017 to 4,024 ms, and/product/5one span of 1,009 to 1,013 ms. Nothing recorded that three requests went out, or that two of them got429. The duration was the only clue. - The model noticed every time. All 7 answers listed pages 2 and 4 as blocked and didn't make up prices for them. If you only read the final answer, the run looks fine. If you only read the telemetry, the run looks perfect.
Where trace context stops
The tool's own spans need to connect to the agent's spans somehow. SEP-414 documents the MCP convention for that: a W3C traceparent in the request's _meta. Claude Code's docs say it passes TRACEPARENT to Bash subprocesses and a traceparent header on outbound HTTP MCP requests. Our stdio server got neither. Its environment had no TRACEPARENT or OTEL_* variables, and every tools/call carried only this in _meta:
{"claudecode/toolUseId": "toolu_01XUkQQiBXSPJ4aXm6B4x3FH", "progressToken": 2}
That ID is enough. It matched the tool_use_id and gen_ai.tool.call.id attributes on Claude Code's spans and events in every run. In -p mode, each claude_code.tool span also arrived as the root of its own trace, so the tool call ID was the most reliable join key anyway. Record it on your tool spans, and you can put the agent's view and the wire's view side by side.
Why retries disappear under HTTP instrumentation
The usual fix for missing HTTP data is auto-instrumentation. It helps, but with one catch: retries that happen below the instrumented call don't get their own spans. We tested opentelemetry-instrumentation 0.66b2 against the same mock pages, with requests 2.34.2 mounting a urllib3.Retry(total=3, backoff_factor=0.5, status_forcelist=[429, 503], respect_retry_after_header=True) adapter, and with httpx 0.28.1 in a hand-written retry loop:
| Setup | Spans for /product/3 (429, 429, 200) |
What the span says |
|---|---|---|
requests instrumentation, urllib3 Retry |
1 | 200, 4,005 ms, status UNSET |
urllib3 instrumentation only, urllib3 Retry |
1 | 200, 4,004 ms, status UNSET |
| requests + urllib3 instrumentation | 1 | Only the requests span appears |
| httpx instrumentation, manual retry loop | 3 | 429 ERROR, 429 ERROR, 200 |
The mock store logged all three requests in every case. When Retry handles the retries, they happen inside a single instrumented call, so you get one span with the final status. The /product/5 result shows something else: urllib3 sent its first retry after the 503 with no delay at all, because its backoff only starts from the second consecutive error. Nobody set http.request.resend_count on any span.
Two smaller details. The /product/4 challenge and the /product/2 block page each got one span, but only the 403 was marked ERROR. A block page served with 200 looks healthy at the HTTP layer too. And the requests and urllib3 instrumentations emit the old http.status_code attribute until you set OTEL_SEMCONV_STABILITY_OPT_IN=http, which switches them to http.response.status_code, as the HTTP migration guide describes. Check which name your dashboards query.
How to trace web requests from an agent tool
The fix is to emit the spans yourself in the tool's network code: one execute_tool span per tool call, one CLIENT span per HTTP attempt, and a block classification on both. This version uses httpx and the OpenTelemetry SDK (tested with httpx 0.28.1 and opentelemetry-sdk 1.45.2 on Python 3.14):
import os
import sys
import time
from datetime import timezone
from email.utils import parsedate_to_datetime
from urllib.parse import urlsplit, urlunsplit

import httpx
from opentelemetry import trace
from opentelemetry.sdk.resources import Resource
from opentelemetry.sdk.trace import TracerProvider
from opentelemetry.sdk.trace.export import SimpleSpanProcessor, ConsoleSpanExporter
from opentelemetry.trace import SpanKind, Status, StatusCode
from opentelemetry.trace.propagation.tracecontext import TraceContextTextMapPropagator

# Console output for the demo. In production, use BatchSpanProcessor(OTLPSpanExporter()).
provider = TracerProvider(resource=Resource.create({"service.name": "agent-web-tools"}))
provider.add_span_processor(SimpleSpanProcessor(ConsoleSpanExporter(
    formatter=lambda s: f"{s.name:28} {s.status.status_code.name:5} {dict(s.attributes)}\n")))
trace.set_tracer_provider(provider)
tracer = trace.get_tracer("agent.web")

RETRY_STATUSES = {429, 503}
MAX_ATTEMPTS = 3
MAX_WAIT_S = 30  # longest Retry-After the tool will wait out
PROXY_URL = os.environ.get("PROXY_URL")              # credentials stay here, never in spans
PROXY_SESSION = os.environ.get("PROXY_SESSION", "")  # a label you choose, e.g. the sticky session ID
UA = "Mozilla/5.0 (X11; Linux x86_64) AppleWebKit/537.36 (KHTML, like Gecko) Chrome/155.0.0.0 Safari/537.36"  # Keep the browser version current.

client = httpx.Client(proxy=PROXY_URL, headers={"user-agent": UA}, timeout=20)


def classify(r: httpx.Response) -> str:
    if r.headers.get("cf-mitigated") == "challenge":
        return "challenge"
    if r.status_code == 429:
        return "rate_limited"
    if r.status_code == 407:
        return "proxy_auth"
    if r.status_code in (401, 403):
        return "forbidden"
    if r.status_code >= 500:
        return "server_error"
    if r.status_code >= 400:
        return "http_error"
    if r.status_code >= 300:  # httpx doesn't follow redirects unless told to
        return "redirect"
    text = r.text[:20000].lower()
    if "verify you are a human" in text or "captcha" in text:
        return "soft_block"
    return "ok"


def retry_after_seconds(r: httpx.Response) -> float | None:
    value = r.headers.get("retry-after", "")
    if value.isdigit():
        return float(value)
    try:  # HTTP-date form
        when = parsedate_to_datetime(value)
    except (TypeError, ValueError):
        return None
    if when.tzinfo is None:  # HTTP dates are always UTC
        when = when.replace(tzinfo=timezone.utc)
    return max(0.0, when.timestamp() - time.time())


def span_url(url: str) -> str:
    """The URL without userinfo, query string, or fragment, which can carry credentials and tokens."""
    parts = urlsplit(url)
    host = parts.netloc.rpartition("@")[2]
    return urlunsplit((parts.scheme, host, parts.path, "", ""))


def fetch_page(url: str, call_id: str, meta: dict | None = None) -> tuple[str, httpx.Response]:
    """One execute_tool span per tool call, one CLIENT span per HTTP attempt."""
    parent = TraceContextTextMapPropagator().extract(meta or {})  # uses _meta.traceparent if the client sent one
    with tracer.start_as_current_span("execute_tool fetch_page", context=parent, attributes={
        "gen_ai.operation.name": "execute_tool",
        "gen_ai.tool.name": "fetch_page",
        "gen_ai.tool.call.id": call_id,
        "server.address": urlsplit(url).hostname,
        "app.proxy.session": PROXY_SESSION,
    }) as tool_span:
        for attempt in range(MAX_ATTEMPTS):
            with tracer.start_as_current_span("GET", kind=SpanKind.CLIENT, attributes={
                "http.request.method": "GET",
                "url.full": span_url(url),
                "server.address": urlsplit(url).hostname,
                "app.proxy.session": PROXY_SESSION,
            }) as span:
                if attempt:
                    span.set_attribute("http.request.resend_count", attempt)
                r = client.get(url)
                outcome = classify(r)
                span.set_attribute("http.response.status_code", r.status_code)
                span.set_attribute("app.fetch.outcome", outcome)
                for h in ("retry-after", "cf-mitigated"):
                    if h in r.headers:
                        span.set_attribute(f"http.response.header.{h}", [r.headers[h]])
                if r.status_code >= 400:
                    span.set_attribute("error.type", str(r.status_code))
                    span.set_status(Status(StatusCode.ERROR))
            if r.status_code not in RETRY_STATUSES or attempt == MAX_ATTEMPTS - 1:
                break
            wait = retry_after_seconds(r)
            if wait is None:
                wait = 2 ** attempt  # no usable Retry-After: short backoff
            if wait > MAX_WAIT_S:
                break  # a longer pause than this call can wait: report the outcome
            time.sleep(wait)

        tool_span.set_attribute("app.fetch.attempts", attempt + 1)
        tool_span.set_attribute("app.fetch.outcome", outcome)
        if outcome != "ok":
            tool_span.set_attribute("error.type", outcome)
            tool_span.set_status(Status(StatusCode.ERROR, outcome))
        return outcome, r


if __name__ == "__main__":
    for i, url in enumerate(sys.argv[1:], start=1):
        fetch_page(url, call_id=f"demo-{i}")
Install httpx and opentelemetry-sdk, then pass URLs on the command line. Run against the mock store's /product/3 and /product/4 through a local authenticating proxy, it printed:
GET                          ERROR {'http.request.method': 'GET', 'url.full': 'http://127.0.0.1:18980/product/3', 'server.address': '127.0.0.1', 'app.proxy.session': 'task-42', 'http.response.status_code': 429, 'app.fetch.outcome': 'rate_limited', 'http.response.header.retry-after': ('2',), 'error.type': '429'}
GET                          ERROR {'http.request.method': 'GET', 'url.full': 'http://127.0.0.1:18980/product/3', 'server.address': '127.0.0.1', 'app.proxy.session': 'task-42', 'http.request.resend_count': 1, 'http.response.status_code': 429, 'app.fetch.outcome': 'rate_limited', 'http.response.header.retry-after': ('2',), 'error.type': '429'}
GET                          UNSET {'http.request.method': 'GET', 'url.full': 'http://127.0.0.1:18980/product/3', 'server.address': '127.0.0.1', 'app.proxy.session': 'task-42', 'http.request.resend_count': 2, 'http.response.status_code': 200, 'app.fetch.outcome': 'ok'}
execute_tool fetch_page      UNSET {'gen_ai.operation.name': 'execute_tool', 'gen_ai.tool.name': 'fetch_page', 'gen_ai.tool.call.id': 'demo-1', 'server.address': '127.0.0.1', 'app.proxy.session': 'task-42', 'app.fetch.attempts': 3, 'app.fetch.outcome': 'ok'}
GET                          ERROR {'http.request.method': 'GET', 'url.full': 'http://127.0.0.1:18980/product/4', 'server.address': '127.0.0.1', 'app.proxy.session': 'task-42', 'http.response.status_code': 403, 'app.fetch.outcome': 'challenge', 'http.response.header.cf-mitigated': ('challenge',), 'error.type': '403'}
execute_tool fetch_page      ERROR {'gen_ai.operation.name': 'execute_tool', 'gen_ai.tool.name': 'fetch_page', 'gen_ai.tool.call.id': 'demo-2', 'server.address': '127.0.0.1', 'app.proxy.session': 'task-42', 'app.fetch.attempts': 1, 'app.fetch.outcome': 'challenge', 'error.type': 'challenge'}
The proxy credentials don't appear anywhere in the output. Credentials or tokens in the target URL don't either: span_url drops the userinfo, query string, and fragment from url.full, and the request still goes out with the full URL. The GET spans also show what the agent's trace couldn't: three attempts, two waits, and why the call took 4 seconds.
A few details worth knowing:
- Call ID. In an MCP server, pass
_meta["claudecode/toolUseId"]ascall_idwhen the client is Claude Code. Other clients may send their own ID, or none. If a client sendstraceparentin_meta, the propagator line makes your spans children of the agent's span, and you don't need the join. - Tell the runtime. When the outcome isn't
ok, return the MCP result withisError: trueand a short message such asoutcome=challenge status=403 attempts=1. The MCP tools spec definesisErrorfor tool execution errors, and in our test it was the only thing that changed Claude Code'ssuccessflag. It also stops the model from reading challenge HTML as content. - Retry-After.
retry_after_secondsreads both forms of the header, seconds and an HTTP date. When the server asks for a longer wait thanMAX_WAIT_S, the tool stops and reports the outcome rather than retrying early. - Redirects. httpx doesn't follow redirects by default, so
classifyreports a3xxasredirectinstead ofok. Put theLocationheader in the error message and let the agent fetch the new URL as its own tool call. Withfollow_redirects=True, every hop would share oneGETspan. - Exceptions. A dead proxy raises
httpx.ConnectError.start_as_current_spanrecords it as anexceptionevent and sets both spans toERROR, but it doesn't seterror.type, so catch it if your dashboards group by that attribute. On HTTPS URLs, a rejected proxy login raiseshttpx.ProxyErrorinstead of returning a407response. - Soft blocks are site-specific. The two body markers in
classifyare examples. Add the phrases and page titles your target sites actually use, and test them against saved block pages.
For browser-based agents, the HTTP layer lives inside the browser, so per-request spans are harder to get. Record a HAR per task instead. In Playwright, browser.new_context(record_har_path="task-42.har") writes one when the context closes. The HAR analyzer shows which requests came back 403 or 429.
Block signals to record on every request
The classifier only works if the attributes behind it get recorded. These are the signals that separated the outcomes in our test, plus the proxy-side ones:
| Signal | Where it shows | Record as |
|---|---|---|
cf-mitigated: challenge |
Response header, any status | http.response.header.cf-mitigated, outcome challenge |
429 plus Retry-After |
Status and header | Status, http.response.header.retry-after, outcome rate_limited |
401 / 403 with no challenge header |
Status | Outcome forbidden |
200 with block-page markers |
Body only | Outcome soft_block; HTTP metrics alone will miss it |
407, or ProxyError on HTTPS |
Proxy response or exception | Outcome proxy_auth; the site never saw the request |
| Retry number | Your retry loop | http.request.resend_count |
| Proxy session label | Your config | A custom attribute such as app.proxy.session |
The proxy session label is what lets you tell "this site blocks us" apart from "this exit is burned." If one session label has most of the challenges for a domain and the others don't, that points to IP reputation. If every session gets them, look at your request rate, headers, or the site's policy. How websites detect AI agents covers the signals sites check besides the IP.
Dashboards and alerts for web agents
Once the spans exist, a few queries cover most incidents:
- Blocked share per domain:
execute_toolspans witherror.typeinchallenge,forbidden, orsoft_block, divided by allexecute_toolspans, grouped byserver.address. Alert on a jump, not on a fixed number. - Blocked share per proxy session: the same ratio grouped by
app.proxy.session. One bad session points to the exit, not to your code. - Attempts per tool call: p95 of
app.fetch.attempts. A rise usually shows tighter rate limiting before tasks start failing. - Soft-block rate:
soft_blockoutcomes on their own. They're the failures that status-code dashboards miss. - Wait time: the
execute_toolspan duration minus the sum of itsGETspan durations. That's the time spent honoringRetry-After. On/product/3it was nearly all of the 4 seconds. - Runs that finished despite blocks: agent runs marked complete that contain at least one blocked tool call. Use this to sample answers and check whether the model reported the gap or papered over it.
If 429s dominate, HTTP 429 Too Many Requests covers the pacing side. If 403s dominate, start with HTTP 403 Forbidden.
What to keep out of agent traces
Traces often go to third-party backends and stay there for weeks, so decide what goes in:
- Proxy credentials. Keep them in the client config, never in attributes. The HTTP conventions say
url.fullmust not contain credentials and should redact them asREDACTED:REDACTED. That matters if you ever trace the proxy URL itself. - Page content. Claude Code's
OTEL_LOG_TOOL_CONTENT=1put the full fetched text into span events. That's useful for debugging soft blocks and risky for pages that show personal data. Turn it on per investigation, not by default. - Account identity. Every Claude Code span in our runs carried the signed-in account's email, account UUID, and organization ID. Filter or hash those at the collector if your trace backend is shared.
- Headers. The HTTP conventions say instrumentations should capture headers only when explicitly configured to. Capture the few that explain blocks, as the snippet does, and never
Cookie,Authorization, orProxy-Authorization.
Where proxies fit
AI agent observability is how you find out whether a proxy would help at all. If the blocked share is spread across every session label and lines up with your request rate, slow down first. A new IP won't fix pacing. If blocks cluster on a cloud server's IP range or on one exit, the exit is the problem.
For agents that read many independent pages, rotating residential proxies spread requests across exits. A rotating line can get a new exit on every request, so record the session label you can see rather than guessing the exit afterwards. For multi-step tasks, give each task one sticky residential session and put its label on every span. Unknown Proxies sticky sessions hold an IP for up to 2 hours, so a task's whole trace maps to one exit. Agents that log in to the same account every day are better served by a static ISP proxy, and its IP can be the label.
A proxy doesn't change a site's terms, robots rules, or rate limits. Use the traces to keep the agent within them. A challenge page is the site telling you something, and the right response is often to stop.
FAQ
What is AI agent observability?
It's the practice of recording what an AI agent did during a run (model calls, tool calls, HTTP requests, and network egress) so you can debug failures, measure cost, and check whether the agent's answer matches what happened. For web agents, the part most often missing is the HTTP layer: status codes, retries, and blocks.
What is the difference between LLM observability and AI agent observability?
LLM observability tracks individual model calls: prompts, outputs, tokens, latency. Agent observability adds the loop around them: which tools ran, in what order, what they returned, and what the tools did in the outside world. A trace can show a perfect model call that acted on a blocked page.
Does OpenTelemetry support AI agents?
Yes. The GenAI semantic conventions define spans such as execute_tool, with attributes like gen_ai.tool.name and gen_ai.tool.call.id, though they're still marked Development. Claude Code exports OpenTelemetry metrics, events, and beta traces, and many LLM observability platforms accept OTLP. The HTTP side uses the standard HTTP client conventions.
Why does my agent trace show success when the page was blocked?
Because the tool returned the block page as normal content. In our test, Claude Code recorded success=true for a 403 challenge and for a 200 block page until the tool returned isError: true. Classify the response in the tool, and report blocks as tool errors.
How do I trace retries in an AI agent?
Retry in your own loop and create one HTTP client span per attempt, with http.request.resend_count on each retry. With urllib3's Retry adapter, the requests and urllib3 instrumentations recorded a 3-attempt fetch as a single span in our test.
Should I log fetched page content in traces?
Only while you're investigating. Page text helps you recognize soft blocks, but it can contain personal data and makes traces much larger. Record the outcome classification and the few headers that explain it on every request, and keep full content for targeted debugging.
Final thoughts
AI agent observability for web agents depends on what the tool reports. Agent runtimes trace the model and the tool call, and they trust the tool's word on whether the call worked. If the tool returns a challenge page as text, the trace says success. If the retries happen inside the HTTP library, the trace shows one long span.
Make the fetch tool the source of truth. Classify every response, return blocks as tool errors, emit one span per HTTP attempt with the tool call ID and proxy session label, and keep credentials and page content out. Then the trace shows what the website saw. When the data says the exit is the problem, compare residential and ISP plans.